

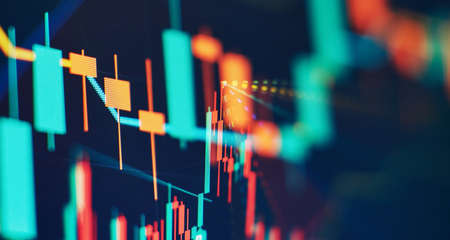
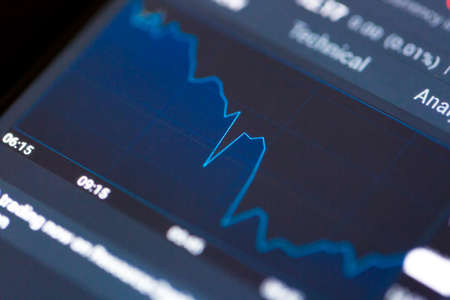
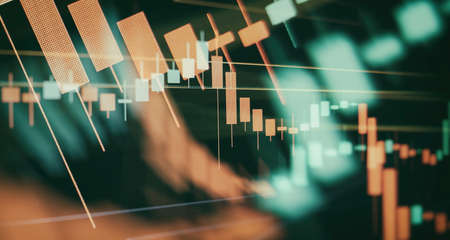
Shallow depth of field (selective focus) with details of a chart showing the stock market crash from March 2020 due to the Covid-19 pandemic on a computer screen (S&P500 index)
Коллекция по умолчанию
Коллекция по умолчанию
Создать новую
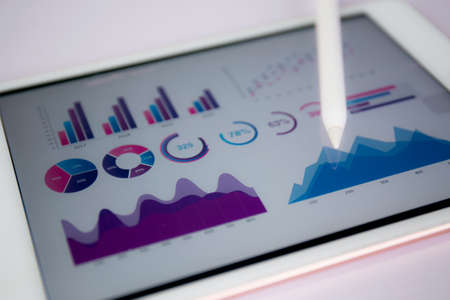
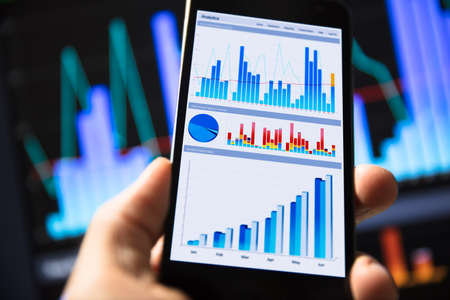
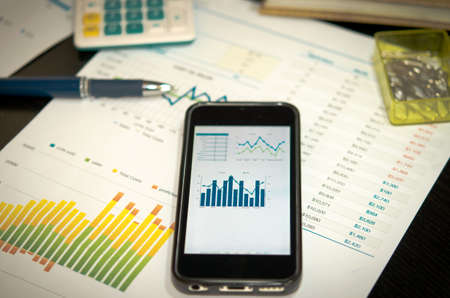
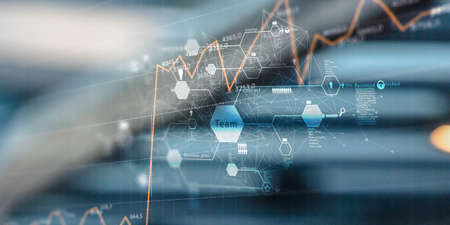
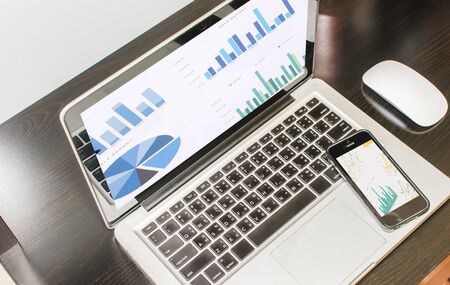
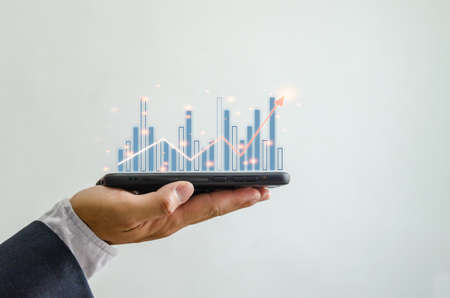
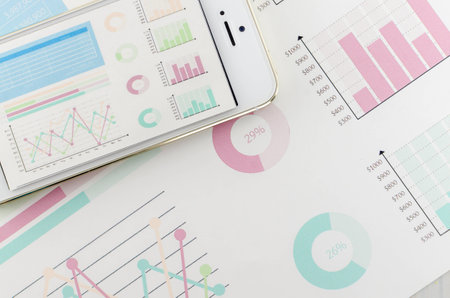
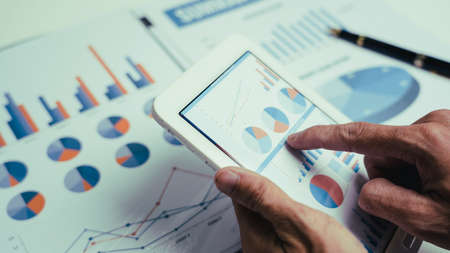
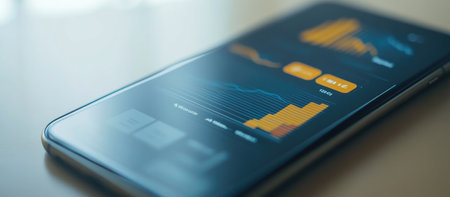
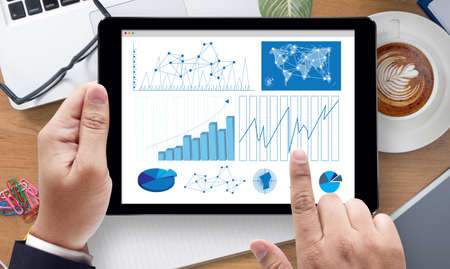
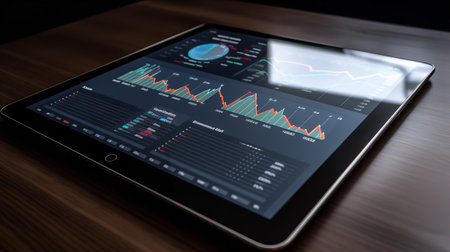
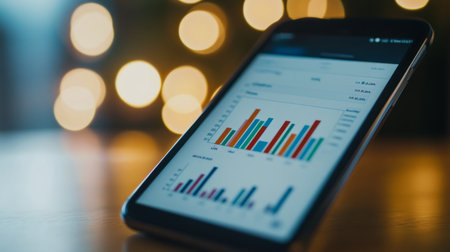
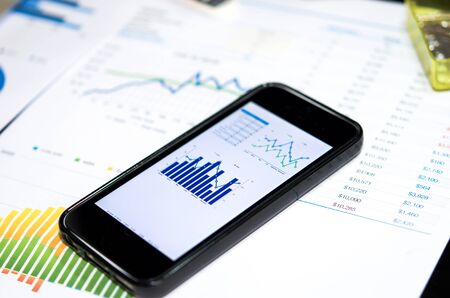
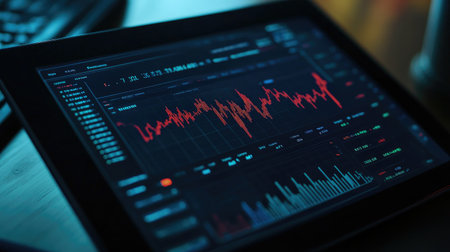
Report graph and chart of investment with finance on tablet computer on desk, datum of stock and growth, planning and statistic with economic, no people, digital marketing, business concept.
Коллекция по умолчанию
Коллекция по умолчанию
Создать новую
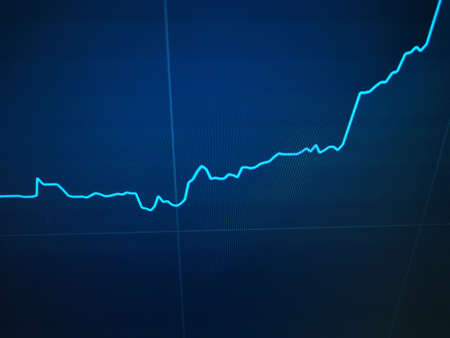
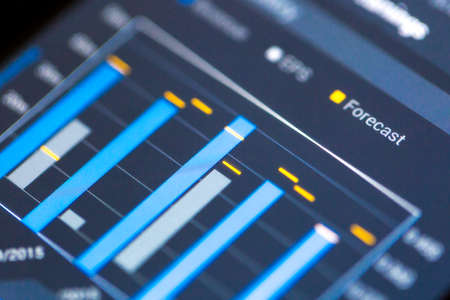
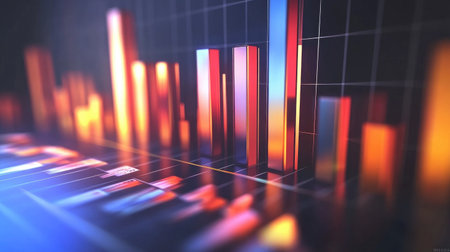
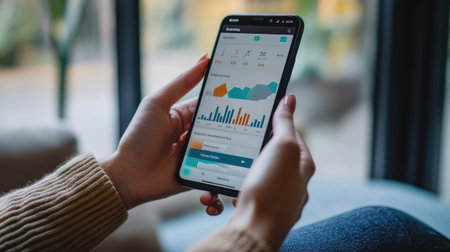
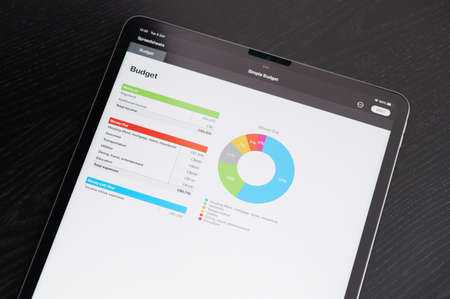
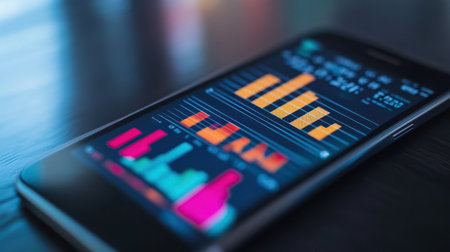
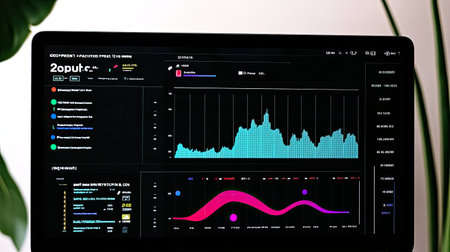
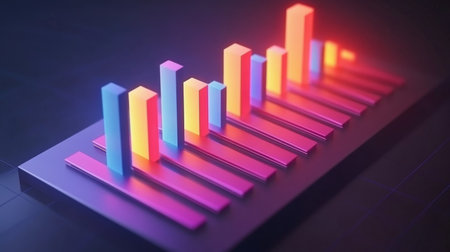
Monthly percentage bar chart showing financial comparison of 2026 budget versus actual performance data displayed on digital screen. Results tracking.
Коллекция по умолчанию
Коллекция по умолчанию
Создать новую

Virus pandemic covid-19 map on pc screen, global infection, internet.
Коллекция по умолчанию
Коллекция по умолчанию
Создать новую

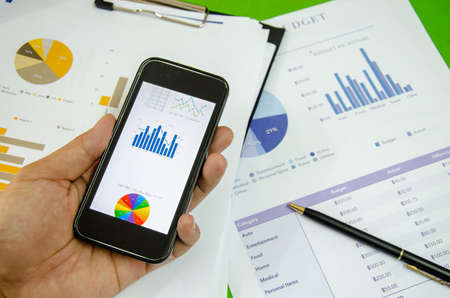
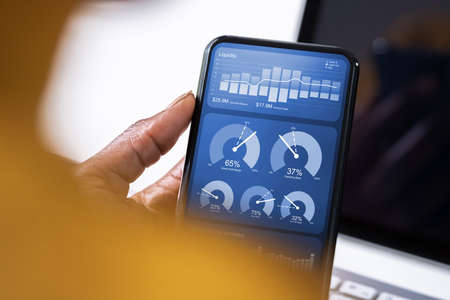
business girl hand holding the device technology smartphone for digital telecom contact to social network internet and data ai cloud storage system concept
Коллекция по умолчанию
Коллекция по умолчанию
Создать новую

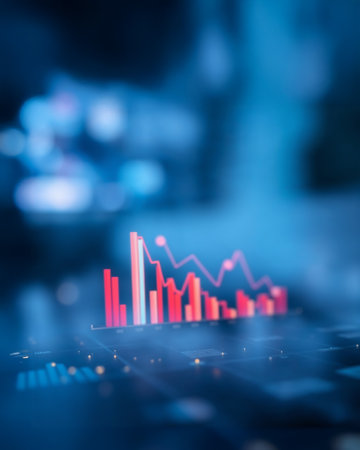
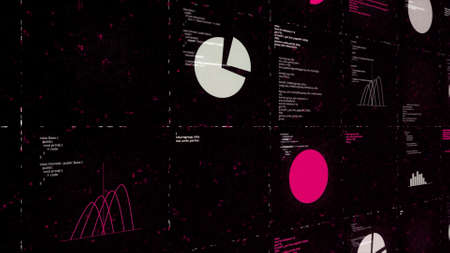
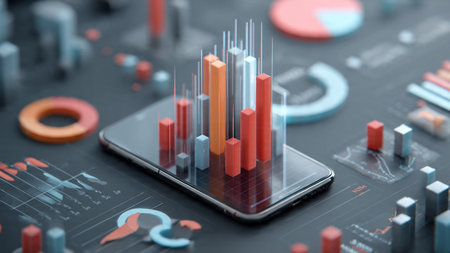
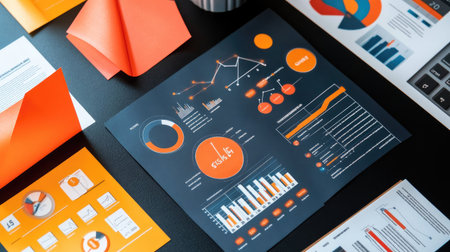
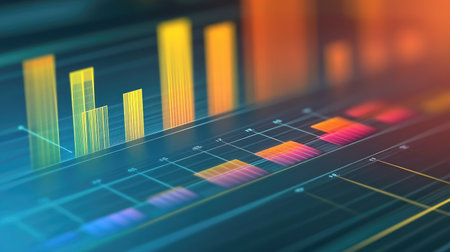
Business chart with line graph, bar chart and numbers on dark background, 3d rendering. Computer digital drawing.
Коллекция по умолчанию
Коллекция по умолчанию
Создать новую
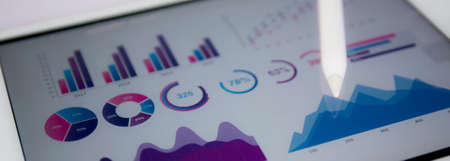
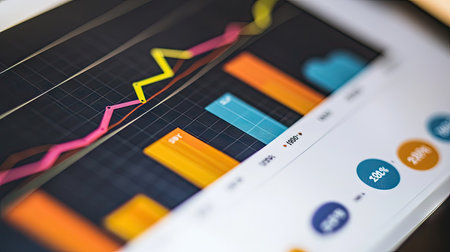
Report graph and chart of investment with finance on tablet computer on desk, datum of stock and growth, planning and statistic with economic, no people, digital marketing, business concept.
Коллекция по умолчанию
Коллекция по умолчанию
Создать новую
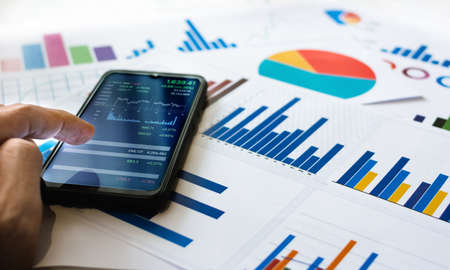
Close up view, asian businessman use finger touching on mobile screen to cheak set index of stocks and analyze chart on paperwork for investment plan
Коллекция по умолчанию
Коллекция по умолчанию
Создать новую

The business plan at the meeting and analyze financial numbers to view the performance of the company.
Коллекция по умолчанию
Коллекция по умолчанию
Создать новую
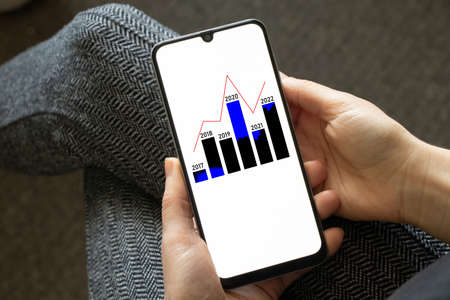
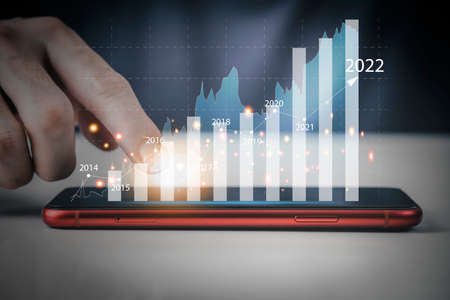
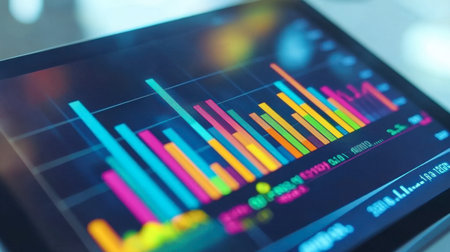
a histogram with columns and years on the screens of a mobile phone in the hands of a girl, an analysis of the years from 2017 to 2022, a sub-view of the totals, a histogram
Коллекция по умолчанию
Коллекция по умолчанию
Создать новую
A colorful bar chart showing quarterly sales growth for a tech startup, with upward trends highlighted
Коллекция по умолчанию
Коллекция по умолчанию
Создать новую
Businessperson With Mobile Phone Showing Graph On Screen
Коллекция по умолчанию
Коллекция по умолчанию
Создать новую
Graphs and phone
Коллекция по умолчанию
Коллекция по умолчанию
Создать новую

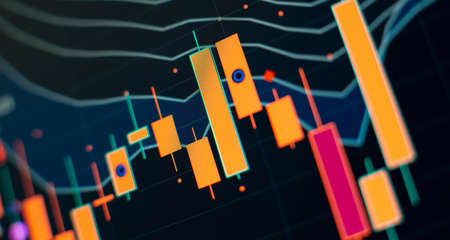
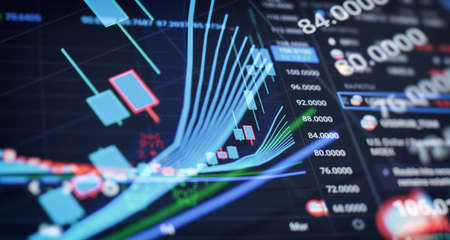
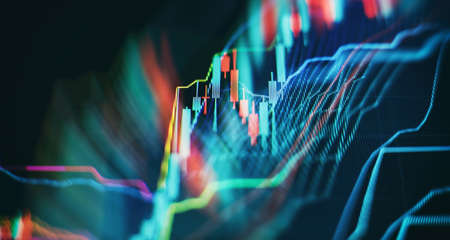
Stockmarket online trading chart candlestick on crypto currency platform. Stock exchange financial market price candles graph data pattern analysis concept. Computer screen closeup background
Коллекция по умолчанию
Коллекция по умолчанию
Создать новую

Trader investor broker holding finger using cell phone app executing financial stock trade market trading order to buy or sell
Коллекция по умолчанию
Коллекция по умолчанию
Создать новую

Stock market or forex trading graph in graphic concept suitable for financial investment or Economic trends business idea and all art work design.
Коллекция по умолчанию
Коллекция по умолчанию
Создать новую
The growth of various indicators in business , Stock Market Investments Funds and Digital Assets ,showing a growing chart virtual hologram on smartphone Business finance background.
Коллекция по умолчанию
Коллекция по умолчанию
Создать новую
Data Analytics Concept Image with Numbers and Charts
Коллекция по умолчанию
Коллекция по умолчанию
Создать новую

Financial instruments with various types of indicators including volume analysis for professional technical analysis
Коллекция по умолчанию
Коллекция по умолчанию
Создать новую

image of the financial graph on a computer monitor.
Коллекция по умолчанию
Коллекция по умолчанию
Создать новую

Financial stock market graph. Stock Exchange. Selective focus.
Коллекция по умолчанию
Коллекция по умолчанию
Создать новую

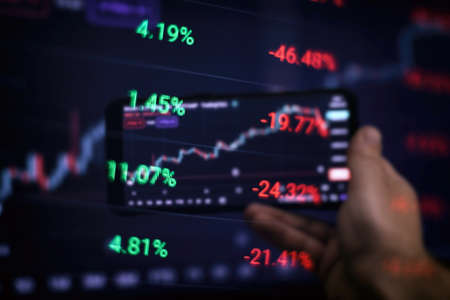
Defocused Woman holding mobile phone, block chain with graph of stock market background, cryptocurrencies or bitcoin concept. Night light. Futuristic stock exchange with general info shown on screen
Коллекция по умолчанию
Коллекция по умолчанию
Создать новую
Business chart with smart phone and pen
Коллекция по умолчанию
Коллекция по умолчанию
Создать новую
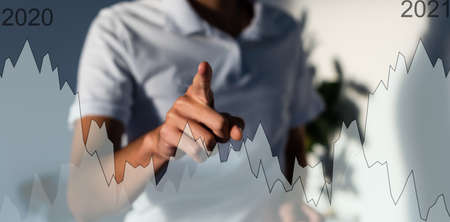
The dynamics of changes in currencies. Price growth chart and economic recovery
Коллекция по умолчанию
Коллекция по умолчанию
Создать новую
business smartphone and pen on desk.
Коллекция по умолчанию
Коллекция по умолчанию
Создать новую
Business and trading finance contept. Stock exchange market chart view on smart phone screen.
Коллекция по умолчанию
Коллекция по умолчанию
Создать новую
Social Web Network Concept . Mixed media
Коллекция по умолчанию
Коллекция по умолчанию
Создать новую
African Advisor Using KPI Dashboard With Financial Analytics Graphs
Коллекция по умолчанию
Коллекция по умолчанию
Создать новую
Woman holding mobile phone, block chain with graph of stock market background, cryptocurrencies or bitcoin concept. Night blue light. Futuristic stock exchange
Коллекция по умолчанию
Коллекция по умолчанию
Создать новую
A 3D bar graph with data labels and percentage values displayed above each bar, providing a clear and informative business analysis
Коллекция по умолчанию
Коллекция по умолчанию
Создать новую

Indicators including volume analysis for professional technical analysis on the monitor of a computer. Fundamental and technical analysis concept.
Коллекция по умолчанию
Коллекция по умолчанию
Создать новую
Digital cyberspace with data analysis process, high tech concept. Animation. Blocks of endlessly written program code, seamless loop.
Коллекция по умолчанию
Коллекция по умолчанию
Создать новую
business analyzing graphs on laptop
Коллекция по умолчанию
Коллекция по умолчанию
Создать новую
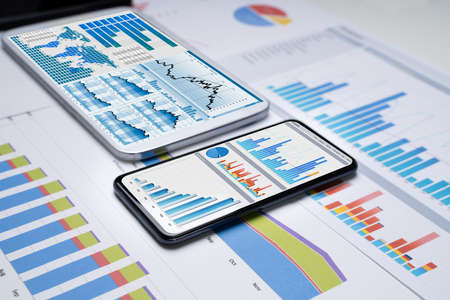
Close-up Of Financial Graphs On Screens Of Multiples Smartphones On Desk
Коллекция по умолчанию
Коллекция по умолчанию
Создать новую

indicators including volume analysis for professional technical analysis on the monitor of a computer. Fundamental and technical analysis concept.
Коллекция по умолчанию
Коллекция по умолчанию
Создать новую

Business and Economy Theme. Trading Cryptocurrencies. Stock Market Candles Chart on Computer Display Close Up.
Коллекция по умолчанию
Коллекция по умолчанию
Создать новую
Volume analysis for professional technical analysis on the monitor of a computer. Fundamental and technical analysis concept.
Коллекция по умолчанию
Коллекция по умолчанию
Создать новую
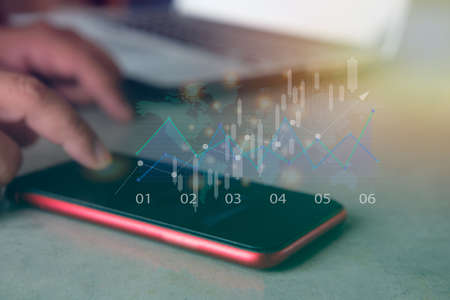
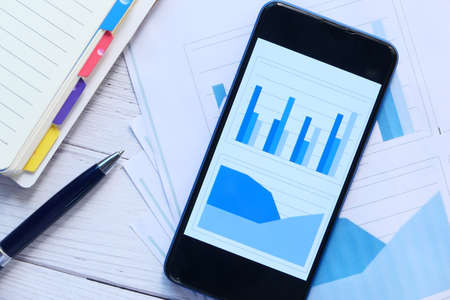
Business planning growth chart increases with Financial Chart on smartphone.Digital communications technology
Коллекция по умолчанию
Коллекция по умолчанию
Создать новую

Financial stock market graph. Stock Exchange. Selective focus.
Коллекция по умолчанию
Коллекция по умолчанию
Создать новую
Graphs
Коллекция по умолчанию
Коллекция по умолчанию
Создать новую

Stock market candlestick chart, asset prices movement, currency exchange price action simple concept. Computer screen, display, candle chart, graph detail, extreme closeup, nobody, no people
Коллекция по умолчанию
Коллекция по умолчанию
Создать новую

Business plan graph growth in tablet screen
Коллекция по умолчанию
Коллекция по умолчанию
Создать новую
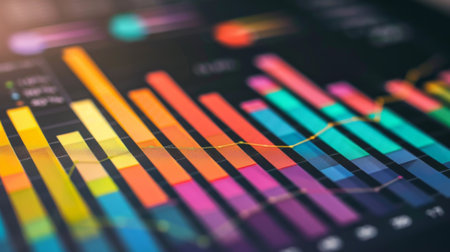
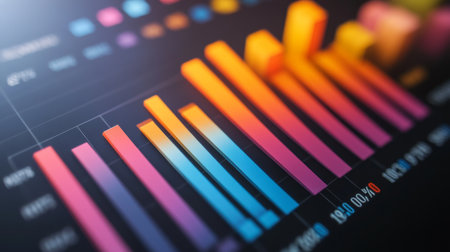
This abstract image features colorful bars representing data visualization, ideal for business and finance concepts, analytics presentations, and digital design projects.
Коллекция по умолчанию
Коллекция по умолчанию
Создать новую
Businessman Asian people individual checking income tax form financial paper document at office.
Коллекция по умолчанию
Коллекция по умолчанию
Создать новую

Vibrant candlestick patterns and descending trend lines illustrate a market downturn, highlighting analysis tools amid a somber financial atmosphere.
Коллекция по умолчанию
Коллекция по умолчанию
Создать новую
Abstract creative financial graph and hand with phone on background, forex and investment concept. Multiexposure
Коллекция по умолчанию
Коллекция по умолчанию
Создать новую
Smartphone with a graph on the screen on a dark background.
Коллекция по умолчанию
Коллекция по умолчанию
Создать новую
A close-up of hands holding a smartphone with a banking app, showing a financial graph of account balances and transactions.
Коллекция по умолчанию
Коллекция по умолчанию
Создать новую

Close-up Of Two Different Colorful Charts On Laptop Keypad
Коллекция по умолчанию
Коллекция по умолчанию
Создать новую

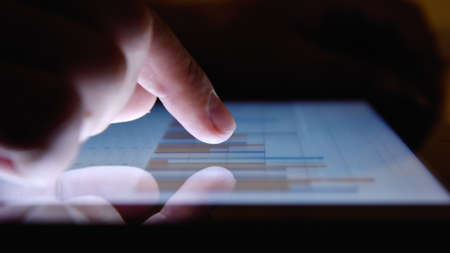
Follow stock prices, stock quotes and the rise and fall of the cryptocurrency on a mobile tablet. The hand draws on the tablet screen using a stylus. close-up small depth of field
Коллекция по умолчанию
Коллекция по умолчанию
Создать новую
New investors use smartphones with a bar graphs of stock to analyze profit and finance performance. Concept digital money, stock
Коллекция по умолчанию
Коллекция по умолчанию
Создать новую
Bright and colorful data visualization displayed on a tablet screen, showcasing key statistics and trends for effective business analysis and decision-making.
Коллекция по умолчанию
Коллекция по умолчанию
Создать новую
A close-up of a smartphone showing a successful digital ad campaign, with metrics for impressions, clicks, and conversions. . --ar 16:7 --v 6.1 Job ID: ba2b8964-ca6d-42ad-96d7-47afdc57ef3b
Коллекция по умолчанию
Коллекция по умолчанию
Создать новую
New york, USA - October 5 2021: Budget spreadsheet charts on tablet screen close up view
Коллекция по умолчанию
Коллекция по умолчанию
Создать новую
A close-up of a business graph on a computer screen, showing detailed line charts and bar graphs with colorful data visualizations.
Коллекция по умолчанию
Коллекция по умолчанию
Создать новую
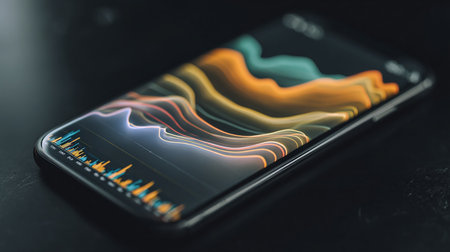
A stunning display of multi-layered, glowing digital waves cascades across a modern screen, blending vivid hues, fine pixel intricacies, and lively illumination in a
Коллекция по умолчанию
Коллекция по умолчанию
Создать новую
Business Research Data Economy , on the tablet pc screen held by businessman hands - online, top view
Коллекция по умолчанию
Коллекция по умолчанию
Создать новую
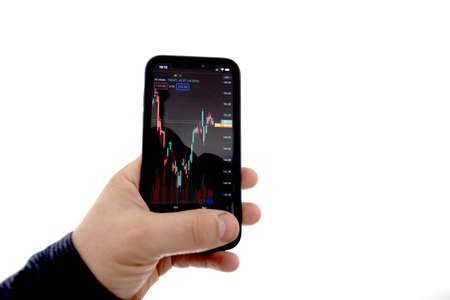
Stock market investment app in hand. Telephone with a stock chart. Screen close-up
Коллекция по умолчанию
Коллекция по умолчанию
Создать новую
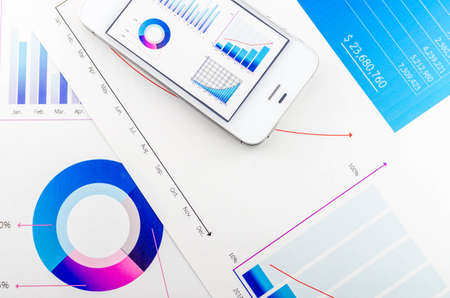
Working set for analyzing financial statistics and analyzing a market data. Data analysis from charts and graphs
Коллекция по умолчанию
Коллекция по умолчанию
Создать новую

Financial stock market graph. Stock Exchange. Selective focus.
Коллекция по умолчанию
Коллекция по умолчанию
Создать новую

Fundamental and technical analysis concept.
Коллекция по умолчанию
Коллекция по умолчанию
Создать новую
A smartphone displays a 3D bar graph surrounded by various data visualization elements on a dark surface
Коллекция по умолчанию
Коллекция по умолчанию
Создать новую
Analyzing financial statistics and analyzing a market data. Data analysis from charts and graphs
Коллекция по умолчанию
Коллекция по умолчанию
Создать новую
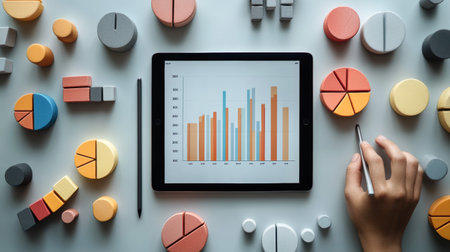
Digital tablet displaying bar charts surrounded by colorful 3D pie charts and blocks. Represents data analysis, business insights, and analytics
Коллекция по умолчанию
Коллекция по умолчанию
Создать новую

Radiated emissions spectrogram with limit lines in EMC electromagnetic compatibility test report
Коллекция по умолчанию
Коллекция по умолчанию
Создать новую

Futuristic user interface with chart and graph. 3d rendering
Коллекция по умолчанию
Коллекция по умолчанию
Создать новую
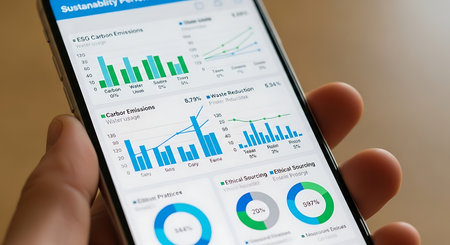
a smartphone in hand showing sustainability data with carbon emissions and waste reduction charts
Коллекция по умолчанию
Коллекция по умолчанию
Создать новую
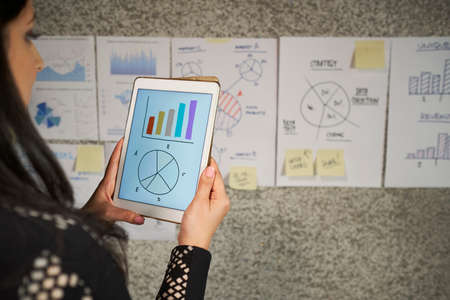
Unrecognizable woman standing in front of papers on wall holding digital tablet computer working with data stats and graphs
Коллекция по умолчанию
Коллекция по умолчанию
Создать новую
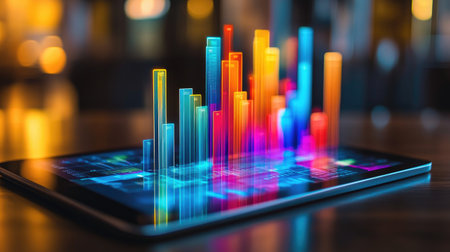
A D bar chart in vibrant colors emerging from a tablet screen, symbolizing modern data analytics and interactive technology in business.
Коллекция по умолчанию
Коллекция по умолчанию
Создать новую
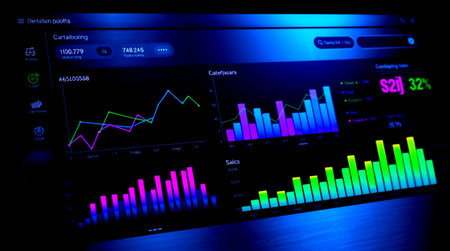
Futuristic dashboard with financial data on a dark background. The concept of business analysis and planning.
Коллекция по умолчанию
Коллекция по умолчанию
Создать новую
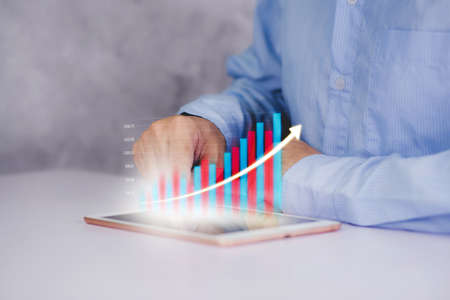
Businessman touch tablet computer with graph and chart of investment and finance, growth of stock and profit, digital marketing, planning of financial and target, business and communication concepts.
Коллекция по умолчанию
Коллекция по умолчанию
Создать новую

graph of financial growth on a computer monitor.
Коллекция по умолчанию
Коллекция по умолчанию
Создать новую

Stock market or forex trading graph in futuristic concept with copyspace
Коллекция по умолчанию
Коллекция по умолчанию
Создать новую
A close-up of graphs and charts displayed on a touch screen tablet, representing data analysis in business operations.
Коллекция по умолчанию
Коллекция по умолчанию
Создать новую

Close up of man hand analyzing stock chart on digital tablet
Коллекция по умолчанию
Коллекция по умолчанию
Создать новую

Shallow depth of field (selective focus) with details of a candlestick chart on a computer screen.
Коллекция по умолчанию
Коллекция по умолчанию
Создать новую

Business success and growth concept. Stock market business graph chart on digital screen. Forex market, Gold market and Crude oil market.
Коллекция по умолчанию
Коллекция по умолчанию
Создать новую

The Stock Exchange, Streaming Trade Screen, The stock screen shows a list of stocks with reduced value.
Коллекция по умолчанию
Коллекция по умолчанию
Создать новую
A close-up of a data analysis graph on a smartphone, showing growth trends and performance indicators.
Коллекция по умолчанию
Коллекция по умолчанию
Создать новую

Investment, trade, stock, finance and analysis , Economic graph with diagrams on the stock market, for business and financial concepts
Коллекция по умолчанию
Коллекция по умолчанию
Создать новую

Business chart with line graph, bar chart and numbers on dark background, 3d rendering. Computer digital drawing.
Коллекция по умолчанию
Коллекция по умолчанию
Создать новую
financial charts display on smart phone on table
Коллекция по умолчанию
Коллекция по умолчанию
Создать новую
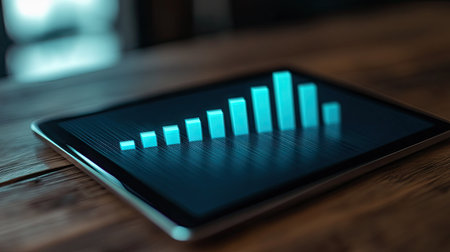
A close-up of a tablet displaying a digital growth chart with bright, upward-trending bars.
Коллекция по умолчанию
Коллекция по умолчанию
Создать новую
A vibrant collection of data visualization elements including colorful charts and graphs arranged on a dark surface, ideal for business analysis and presentation needs.
Коллекция по умолчанию
Коллекция по умолчанию
Создать новую
A close-up of a bar chart on a smartphone screen, with financial data and trends visible, showcasing the ease of accessing financial information on the go.
Коллекция по умолчанию
Коллекция по умолчанию
Создать новую
Financial statistics, stock exchange prices summarized in candle stick chart.
Коллекция по умолчанию
Коллекция по умолчанию
Создать новую
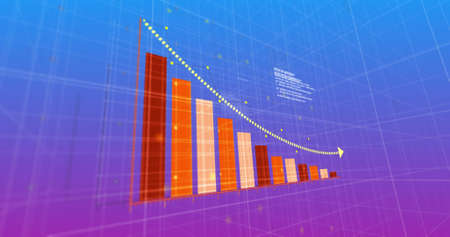
Image of financial data processing over blue background. global business, finances and data processing concept digitally generated image.
Коллекция по умолчанию
Коллекция по умолчанию
Создать новую
A detailed bar graph displayed on a business presentation slide, with clear labels and an emphasis on comparative data across different categories.
Коллекция по умолчанию
Коллекция по умолчанию
Создать новую
Trader touching digital tablet screen with growth of financial stock markets. Success and start up concept. Close up
Коллекция по умолчанию
Коллекция по умолчанию
Создать новую
Smart phone and chart on the table.
Коллекция по умолчанию
Коллекция по умолчанию
Создать новую

A detailed close-up view of a candlestick chart displaying stock data. The graphic illustrates financial trends with vibrant colors, aiding data analysis.
Коллекция по умолчанию
Коллекция по умолчанию
Создать новую
businessman hand working with virtual chart business on touch screen computer as concept
Коллекция по умолчанию
Коллекция по умолчанию
Создать новую
Image of data processing over blue background. Global connections, data processing and digital interface concept digitally generated image.
Коллекция по умолчанию
Коллекция по умолчанию
Создать новую
Business and trading finance contept. Stock exchange market chart view on smart phone screen.
Коллекция по умолчанию
Коллекция по умолчанию
Создать новую
Detailed shot of a stock chart with market trends and performance metrics displayed on a tablet or laptop
Коллекция по умолчанию
Коллекция по умолчанию
Создать новую
A sleek digital dashboard showcasing market analysis with engaging charts. Ideal for professionals seeking insights into financial performance and trends.
Коллекция по умолчанию
Коллекция по умолчанию
Создать новую
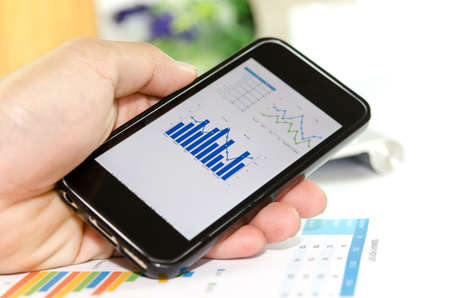
Image of working place with mobile phone
Коллекция по умолчанию
Коллекция по умолчанию
Создать новую
This vibrant 3D bar graph showcases colorful bars in neon hues, ideal for data visualization and analysis in modern business presentations and reports.
Коллекция по умолчанию
Коллекция по умолчанию
Создать новую
Stock market graph and business. Stock or business market analysis concept.
Коллекция по умолчанию
Коллекция по умолчанию
Создать новую
Charts of financial instruments with various types of indicators including volume analysis for professional technical analysis on the monitor of a computer.
Коллекция по умолчанию
Коллекция по умолчанию
Создать новую
Legion-Media
Создайте свои проекты на основе качественных стоковых фотографий и видео.


Copyright © Legion-Media.